1 - Expected post-Chinafy results
China Speed Test: Check Your Website's Loading Speed in China

Are you wondering if your website loads in China? And at what speed? In this article, you can learn how to:
Test your website using Chinafy Global Speed Test
Visualize your loading experience using Chinafy Visual Speed Test
Identify factors affecting your website's loading speed in China
When it comes to website accessibility, China presents a unique set of challenges for developers, marketers, and global companies.
Websites that work seamlessly in other parts of the world can encounter technical issues when accessed from within China. This leads to slow load times, and oftentime timeout errors in the loading of your site altogether.
Optimization and accessibility of your website is crucial, and our tools can help diagnose and visualize your China loading performance.
Chinafy Global Speed Test
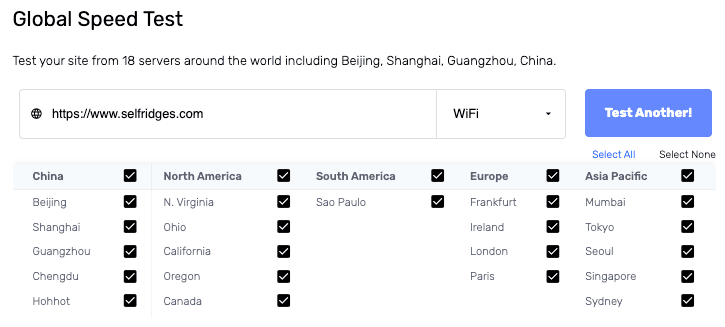
Test your website across 5 servers in China (18 in total) which allow you to test the speed of your site(s) from around the world using various types of connections (i.e. 3G, LTE, Wifi).
How to load your website and gain insight from the Global Speed Test:
Plug your site URL into the test and select which connection type you want to run your test over.
For example, we are testing Selfridges.com
When reading your test results, Loading Time is often the first metric read
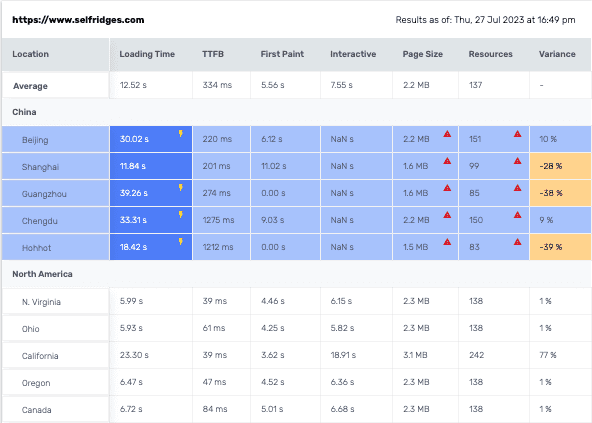
This test returns that Selfridges.com has the following website loading speeds:
6.58 seconds average globally
23.11 seconds average in China
China Website load times for Selfridges.com are 3.51x longer on average.
However, what’s potentially more important is the % Page size, or the # of Resources that successfully loaded (right side). It's normal to expect a variance between the # of resources from region to region. If China is > 5% then parts of the page (generally) are starting to not display properly.
The variance percentage of each of the China servers in this Selfridges test are returning values greater than 5%, indicating that resources are not loading successfully or are missing on the website once loaded in China.
With the issue of slow load times and now potentially missing content, how can we test visually to see the results?
One cool solution is to use our Chinafy Visual Speed Test, to view how a page displays using multiple screenshots compiled into a video for a side by side comparison of your website loading
Chinafy Visual Speed Test
Test your website with a visual side by side comparison of accessing your site from China. With 18 global test locations and different network strengths and speeds available, this crucial test helps you recreate the user experience in China.
Enter your URL and select the connection type to run the test.

Watch a live side by side comparison of your site loading.
Study the Waterfall Chart:
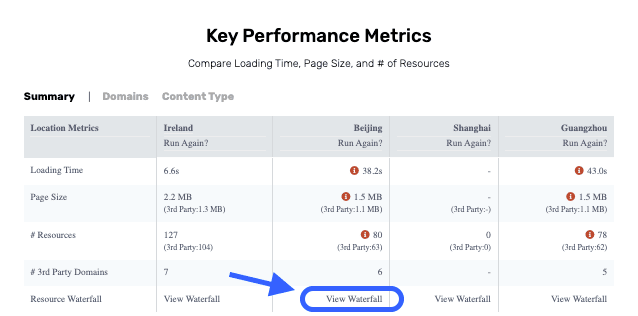
Below the side by side comparison is your Key Comparison Metrics Table. In each test location column is a link to open the waterfall chart for your page at that location.
In the Waterfall Chart, you can gain powerful insights into which elements and resources are loading against a time scale.
Further insights and how to read your Waterfall Chart
In the chart snippet below, we see it took 38.24 seconds to page complete. Each page element displays in the vertical chart (viewable in the right hand column) and the load time and status is represented in a bar chart on the left hand column.
When we read this bar chart against a left-to-right time scale, we will notice that the first 12 or so resources loaded almost immediately. However, we will also see that resources below the 12th on this list loaded a lot closer to the end of our time-scale.
From this little portion of our waterfall chart, we can already glean that a significant portion of this page’s resources are loading close to the 38.24 second page complete!
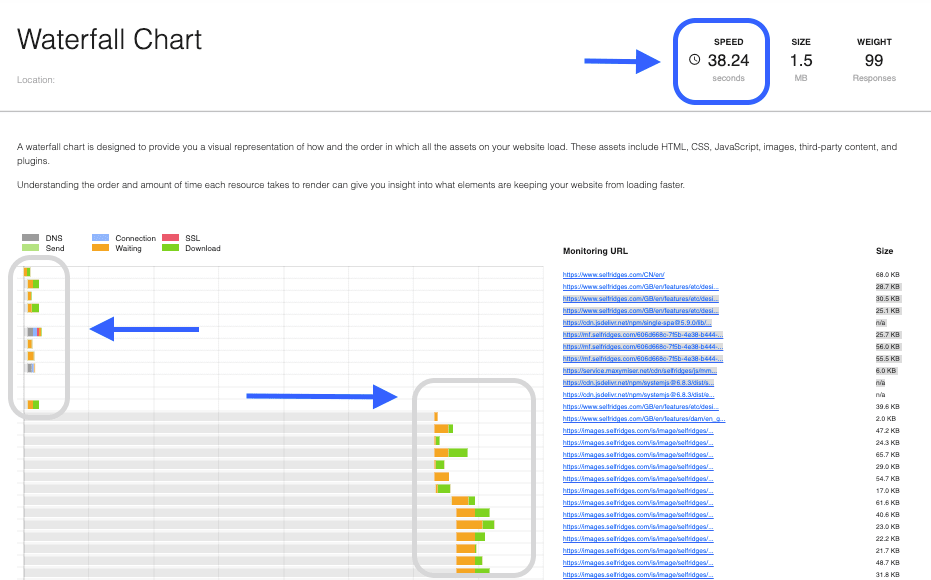
Using a waterfall chart like this is invaluable to view not only a visual time-scale of the loading of each of the site’s resources, but to also diagnose which types of resources and urls are taking the longest to load.
What factors affect your website loading speed in China?
Websites are slow or inaccessible in China for three primary reasons:
They are officially inaccessible from China (e.g. Facebook / Google)
They have code-based incompatibility issues in China; and/or
They have infrastructure-based issues in China
Does it mean all websites are inaccessible in China? Not quite. Chances are that most sites actually appear broken and are mistaken as inaccessible because of technical challenges they have when loading from China.
Do you have a slow website in China? Want to fix it? Get In Touch with our team for an audit of your site today.


1 - Expected post-Chinafy results


